Graphics with Google Docs
- To open Google Docs, click
 > Docs:
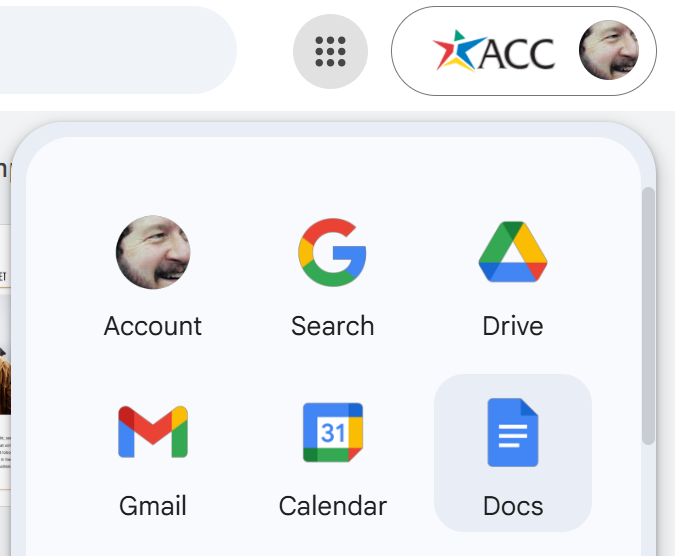
- Select Blank document.
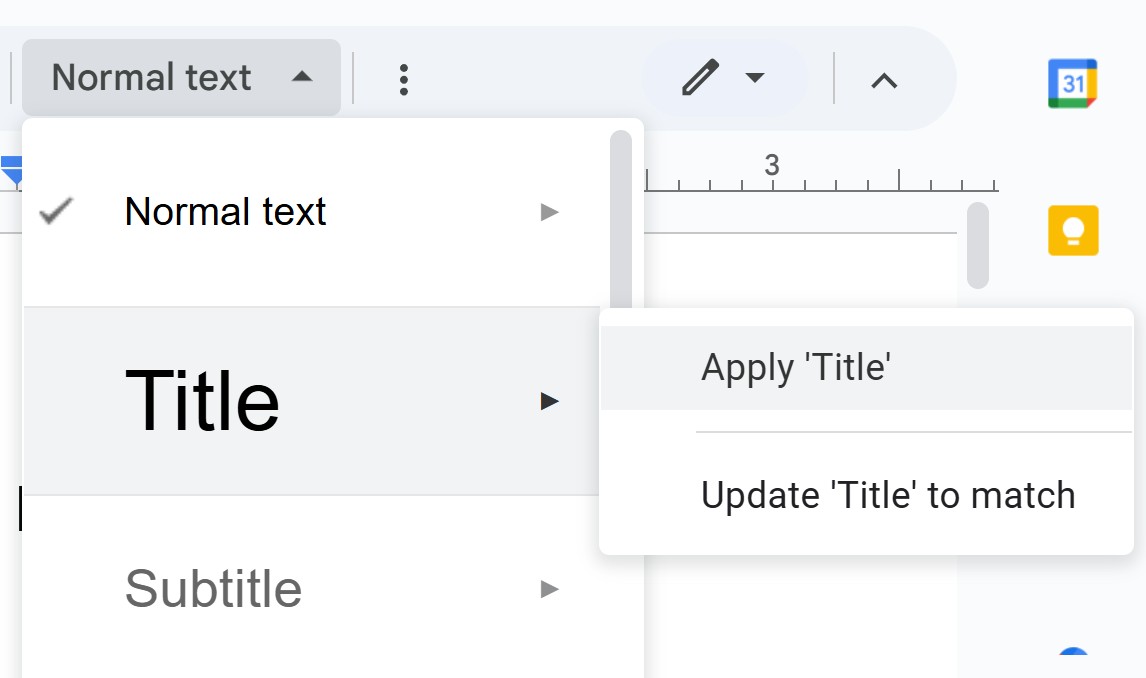
- To add a title, type something like Document Title on the top line (which occurs 1 inch from the top edge).
- With your cursor somewhere with the title text, click Normal text > Title > Apply 'Title'.
- Press Enter to add a new line. Notice that its style changes to Normal text.
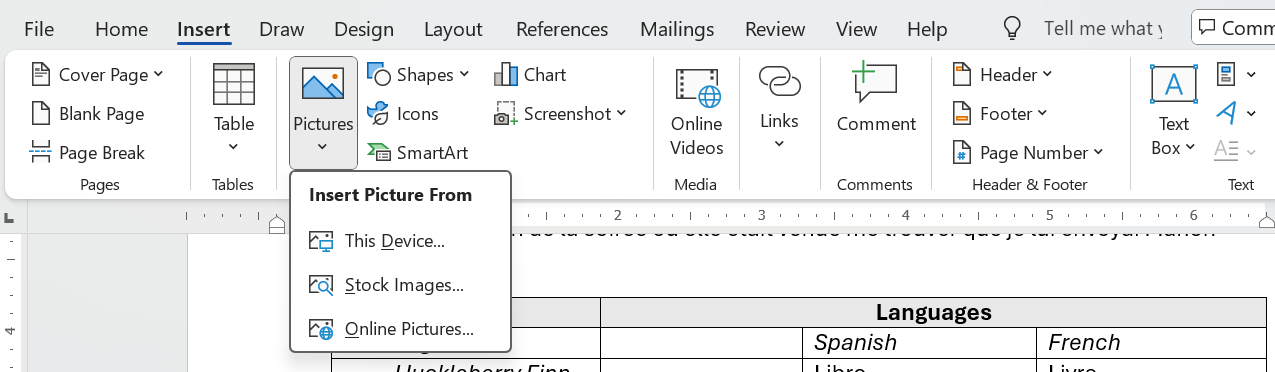
- With your cursor on that same new line, click Insert > Image > Upload from computer.
- Find an image on your computer, select it, and then click Open.
- Click on the image, and explore the available settings:
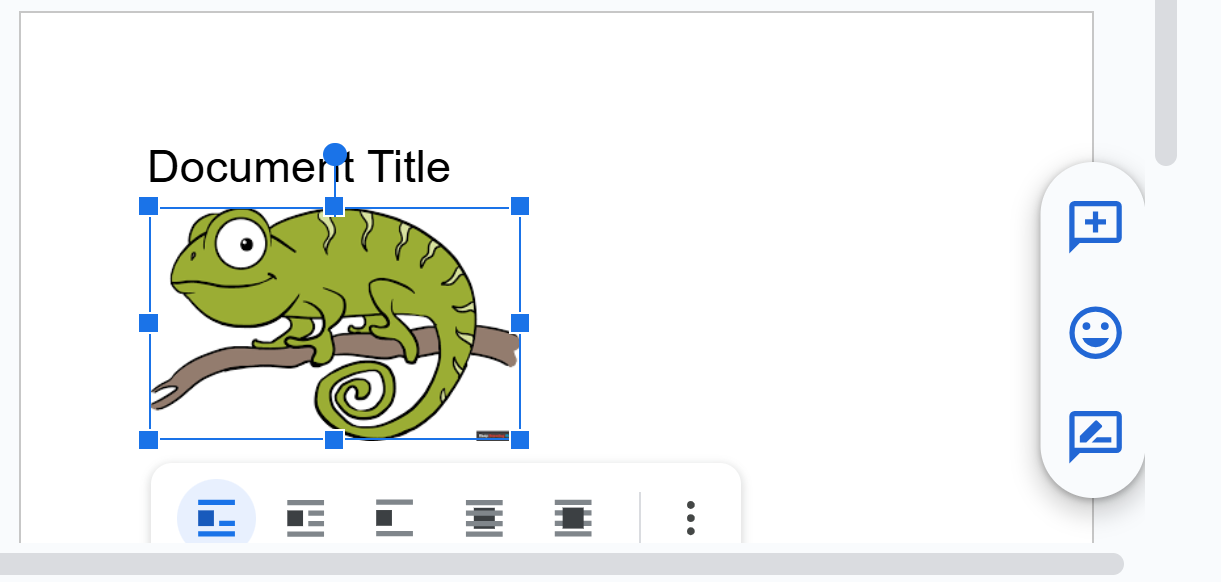
- Select one of the corner blue handles and change the image size.
- Click inside the image, and use the
 (4-arrow icon) to move image on the page.
 - Add some text above or below the image, and experiment with the five location settings:

- Click the 3 dots, Adjustments > Adjustments > Alt text. Type the alt text for your image. (Mine would be Friendly chameleon.)
- For other format:
- Be sure to add an explanatory cross-reference to nearby text somewhere before the graphic: Explanatory Cross-References
- Add a a figure caption if required or necessary. In instructions with lots of screen captures, figure captions are not usually required.
- If you've borrowed the image, you must cite the source: see borrowed graphics.
- Information on automatically incrementing figure captions in Google Docs to come! Hassle me about it!
Graphics with Microsoft Word
First, you'll need to find a graphic. One place to look is Google Chrome:
- Go to Google Chrome: https://www.google.com/chrome/
- Select Images
- Search to find images that you want, for example, search on pelicans
- When you find an image you want, right-click and select Save image as (Chrome).
- Save the image you download somewhere on your computer where you can remember.
Next, insert this image you downloaded in a Word file if you are using Word:
- Move your cursor to a spot in your file where you want the insert the image. Skip a line or two if necessary.
- In Word, click Insert > Picture, select your image, and insert it:
- To format and position it:
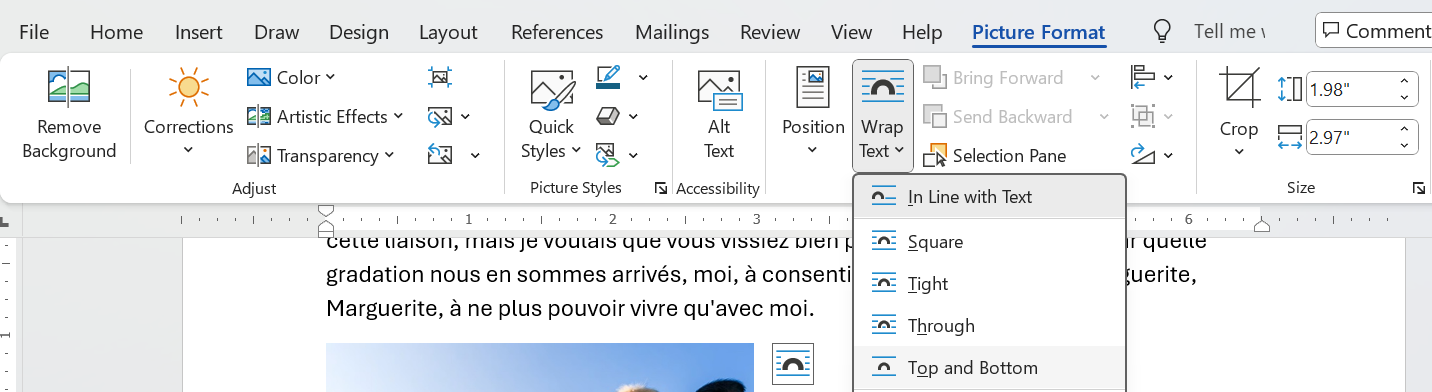
- To position the image freely as you want, select the image, click Picure Format > Wrap Text > Top and Bottom:
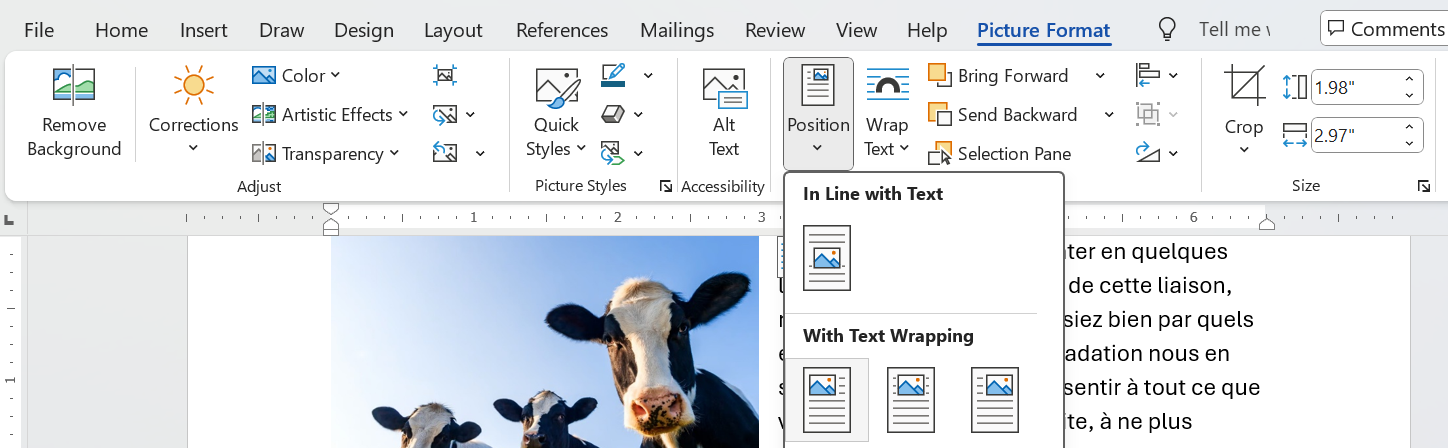
- To force the image to the top of the page and stay there, select tme image, click Position and select one of the items in the top row:
- To enable the image to change position with text added above, click Picure Format > Wrap Text > Top and Bottom:
- For other format:
- Be sure to add an explanatory cross-reference to nearby text somewhere before the graphic: Explanatory Cross-References
- Add a a figure caption if required or necessary. In instructions with lots of screen captures, figure captions are not usually required.
- If you've borrowed the image, you must cite the source: see borrowed graphics.
- If you are using numbered figure captions and want to increment them automatically, see How to Create Multilevel Numbered Headings in Word.
Infographics
Google NotebookLM makes Infographics, such as you see at the top of Writing Process, easy and fun to create.
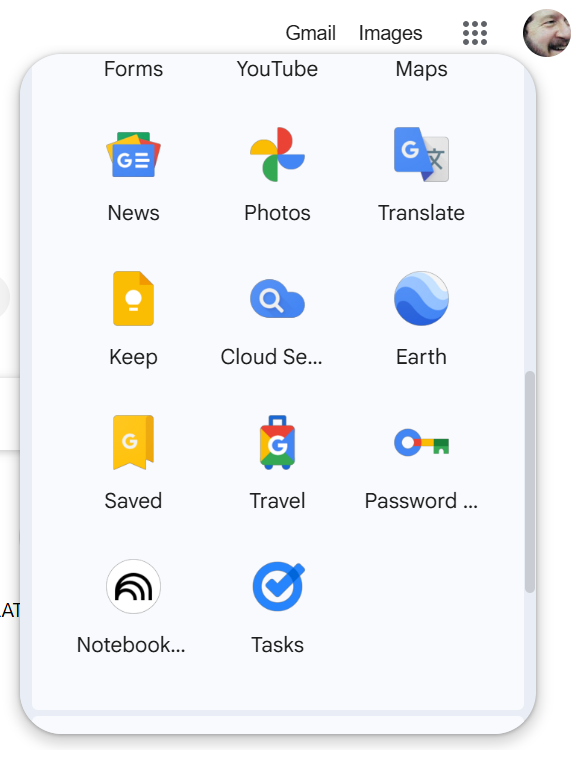
- Open Google Chrome, click the 9-dot icon,and then scroll to Notebook:
- If you've never used NotebookLM before, click Try Notebook. If you have, click Create new notebook.
- Find a web page that shows how to do a task, for example, How to Raise Potatoes in Home Garden
- Copy the URL, in this case https://mcmassociates.io/textbook/examples/instruxx4b.pdf
- Click Untitled Notebook.
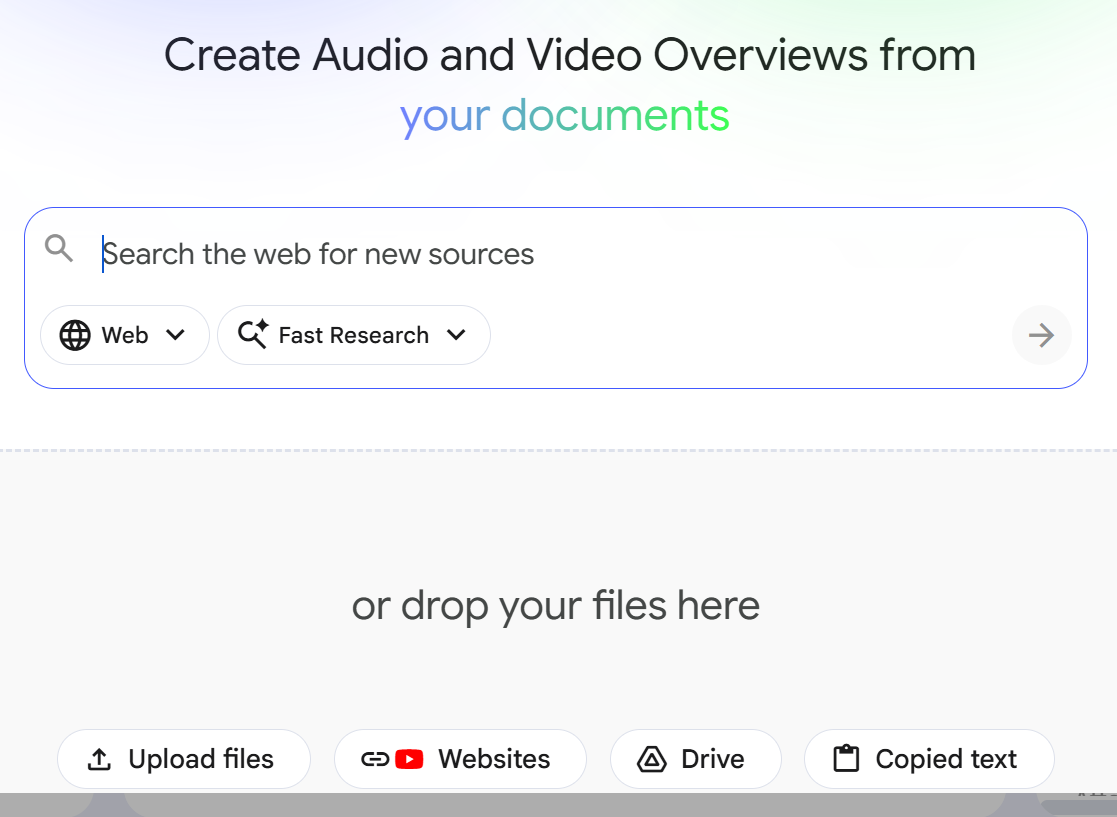
- Because you want to use a URL, click Websites:
- In Website and YouTube URLs, paste your URL over Paste any links and press Insert.
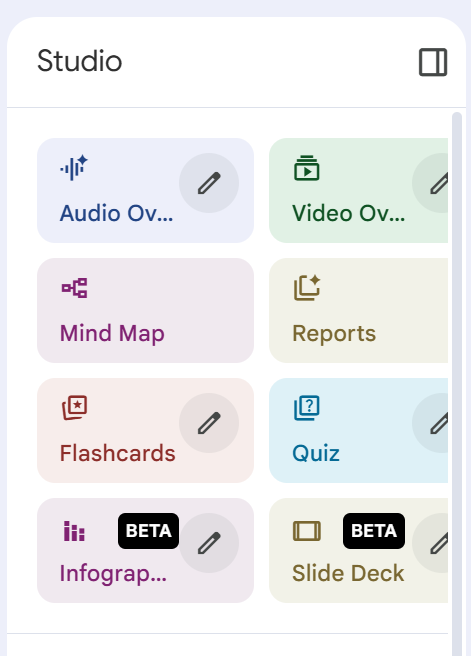
- In the next page, click Infographic:
You'll have to wait a few minutes while NotebookLM processes your request.
The Weekend Essay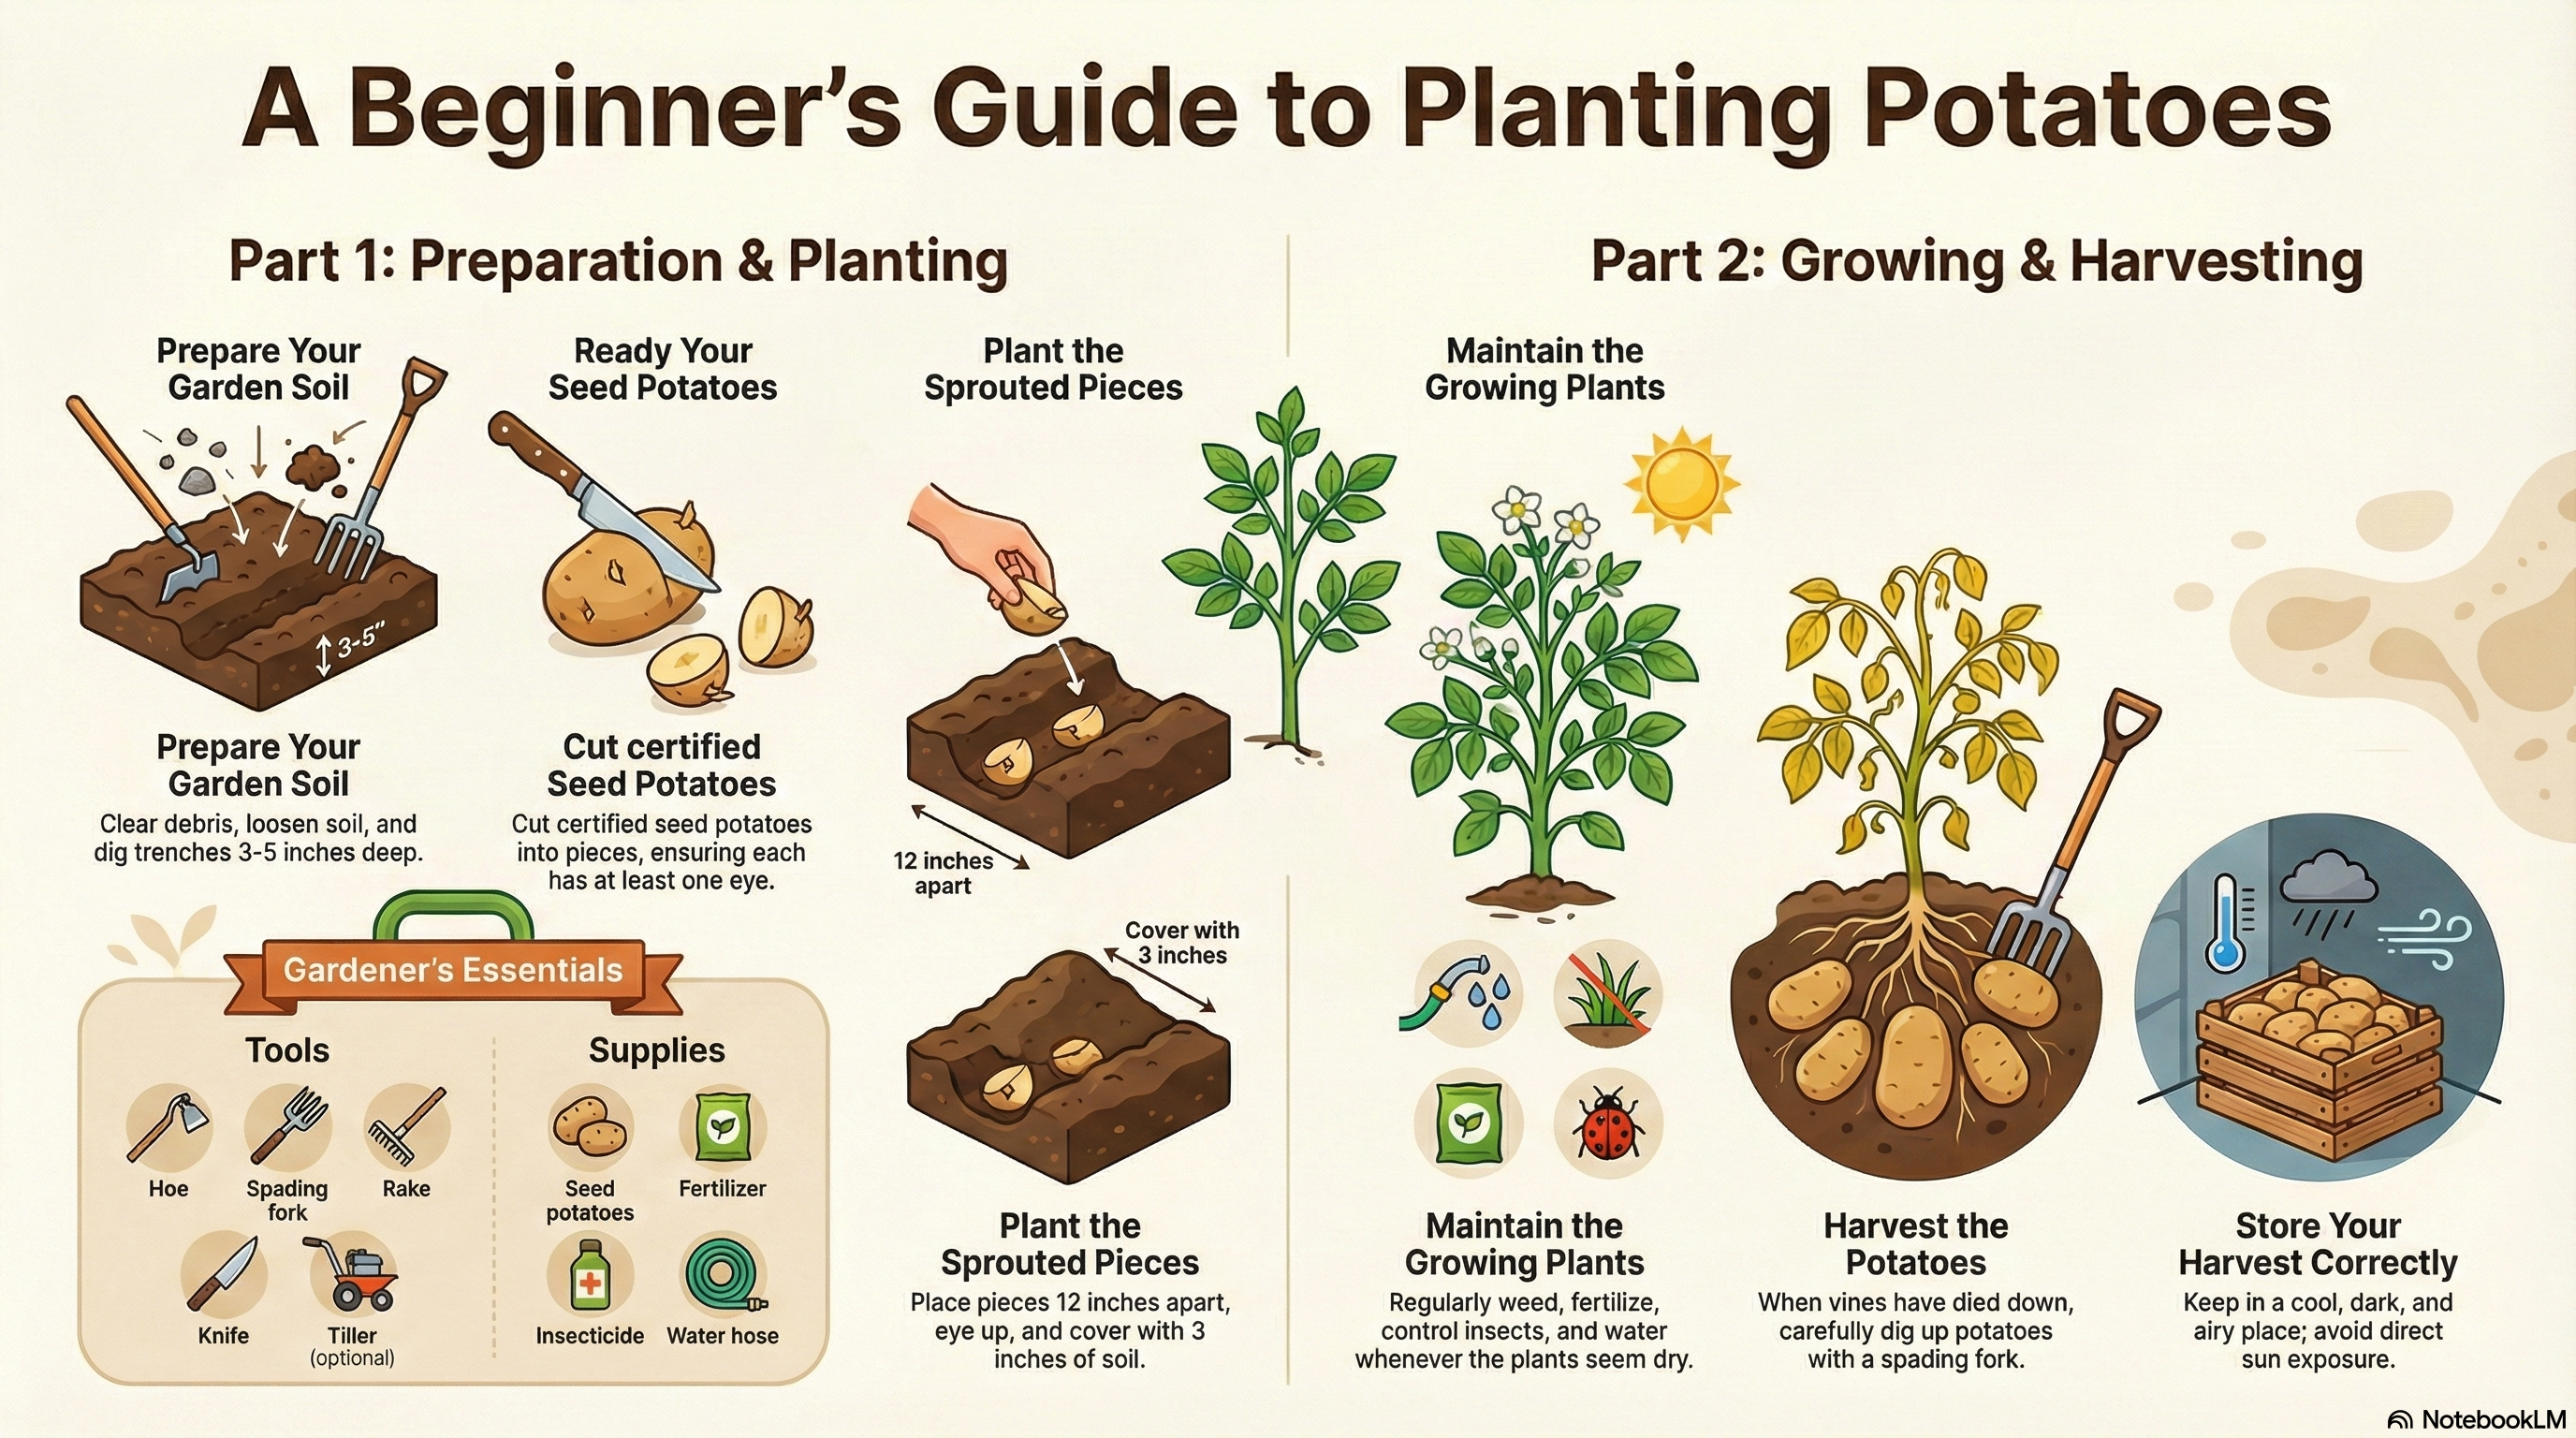 NotebookLM-generated infographic of this chapter
Simple Animation
Coming soon!
Related Information
Free GIF Maker Canva
https://giphy.com/create/gifmaker - can;t set up account
Animate Images using Midjourney Video : Beginner Tutorial [2025] - Technically Trent
The ULTIMATE Beginners Guide to Midjourney in 2025
Midjourney Website Beginner's Guide: Basic Prompting, Tips & Techniques for Customization
Captions, Labels, Source Citations, Cross-References
- Figure titles (captions)—For most charts and graphs, include a title, in many cases, a numbered title. Don't forget to cite the source of any information you borrowed. The standard rule for when to number figures or tables is this: if you cross-reference the figure or table elsewhere in the text.
- Figure labels—Figure labels are those phrases pointing to parts of a graphic indicating their name.
- Source citations—Ii's okay to borrow graphics from other writers, but cite their source, See Sourcing graphics for details.
- Explanatory cross-references—You can't just throw in a figure and say "See Figure 1". That's rude and a lost chance for technical communication. Provide before or after a brief explanation of what to look for in the graphic.
I would appreciate your thoughts, reactions, criticism regarding this chapter: your response—David McMurrey.
Information and programs provided by mcmassociates.io, 1995-2026.

This work is licensed under a Creative Commons Attribution 4.0 International License. - To position the image freely as you want, select the image, click Picure Format > Wrap Text > Top and Bottom: