 NotebookLM-generated infographic of this chapter
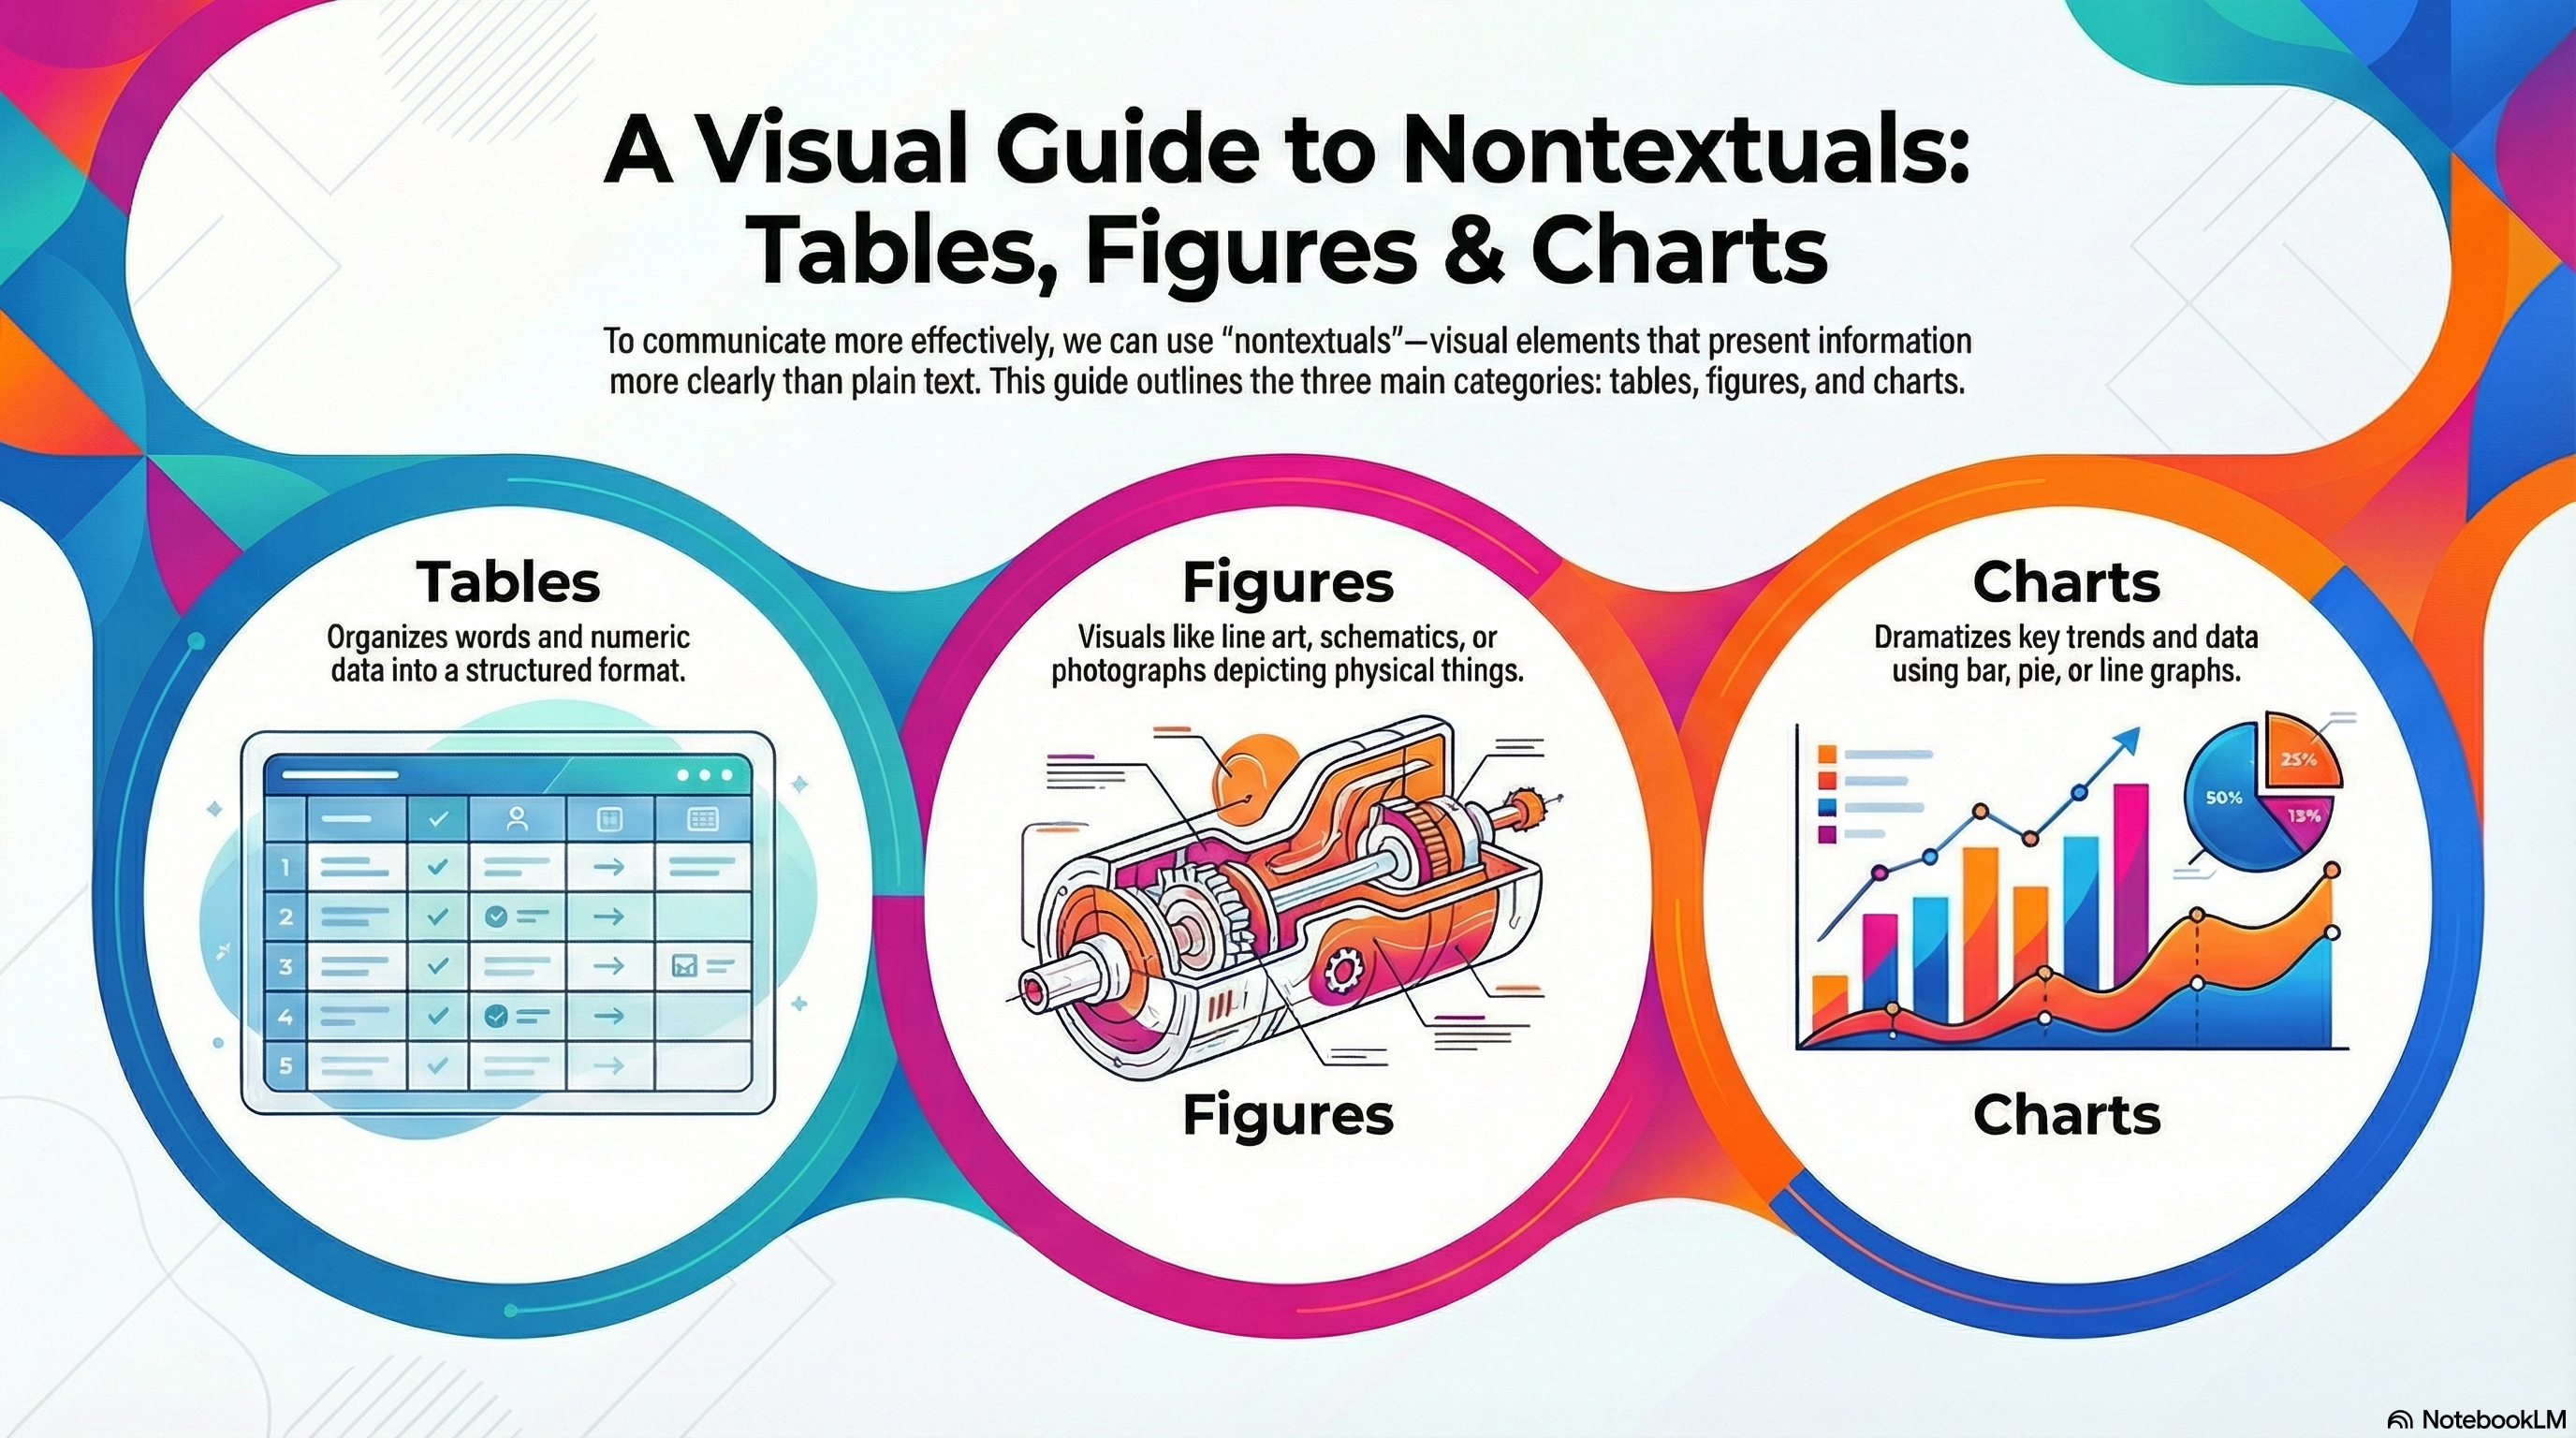
- Tables. True, tables are often fulll of words—not to mention numerics. Because they are not straight text, let's think of them as nontextuals.
- Figures. Sometimes, they are referred to as graphics, sometimwas images. Figures can include line art depicting any physical thing—even schematics. Figures can also include photographs.
- Microsoft Charts or Google Charts Bar charts, column charts, pie charts, line charts—these are often used to dramatize key trends and facts in tables.
I would appreciate your thoughts, reactions, criticism regarding this chapter: your response—David McMurrey.
