Please click here to help David McMurrey pay for web hosting:
Donate any small amount you can !
Online Technical Writing will remain free.
A data report, here, is a report containing lots of data in the form of tables, charts, and graphs. The technical writer:
- starts with source that contains mostly tables.
- creates charts and graphs that more vividly depict the data in those tables.
- adds explanatory cross-references to state key trends and conclusions in the tabular data.
The results of the technical writer's work would be a data report that is much much easier to skim and pick up the key points.
Data reports are used in every industry and branch of government:
- Police departments give reports on crime statistics.
- Public corporations of every kind put out quarterly financial reports.
- Non-profit watchdog groups provide data reports on government spending.
- Environmental consultants report on pollution levels and fish populations.
Be sure to check out the examples.
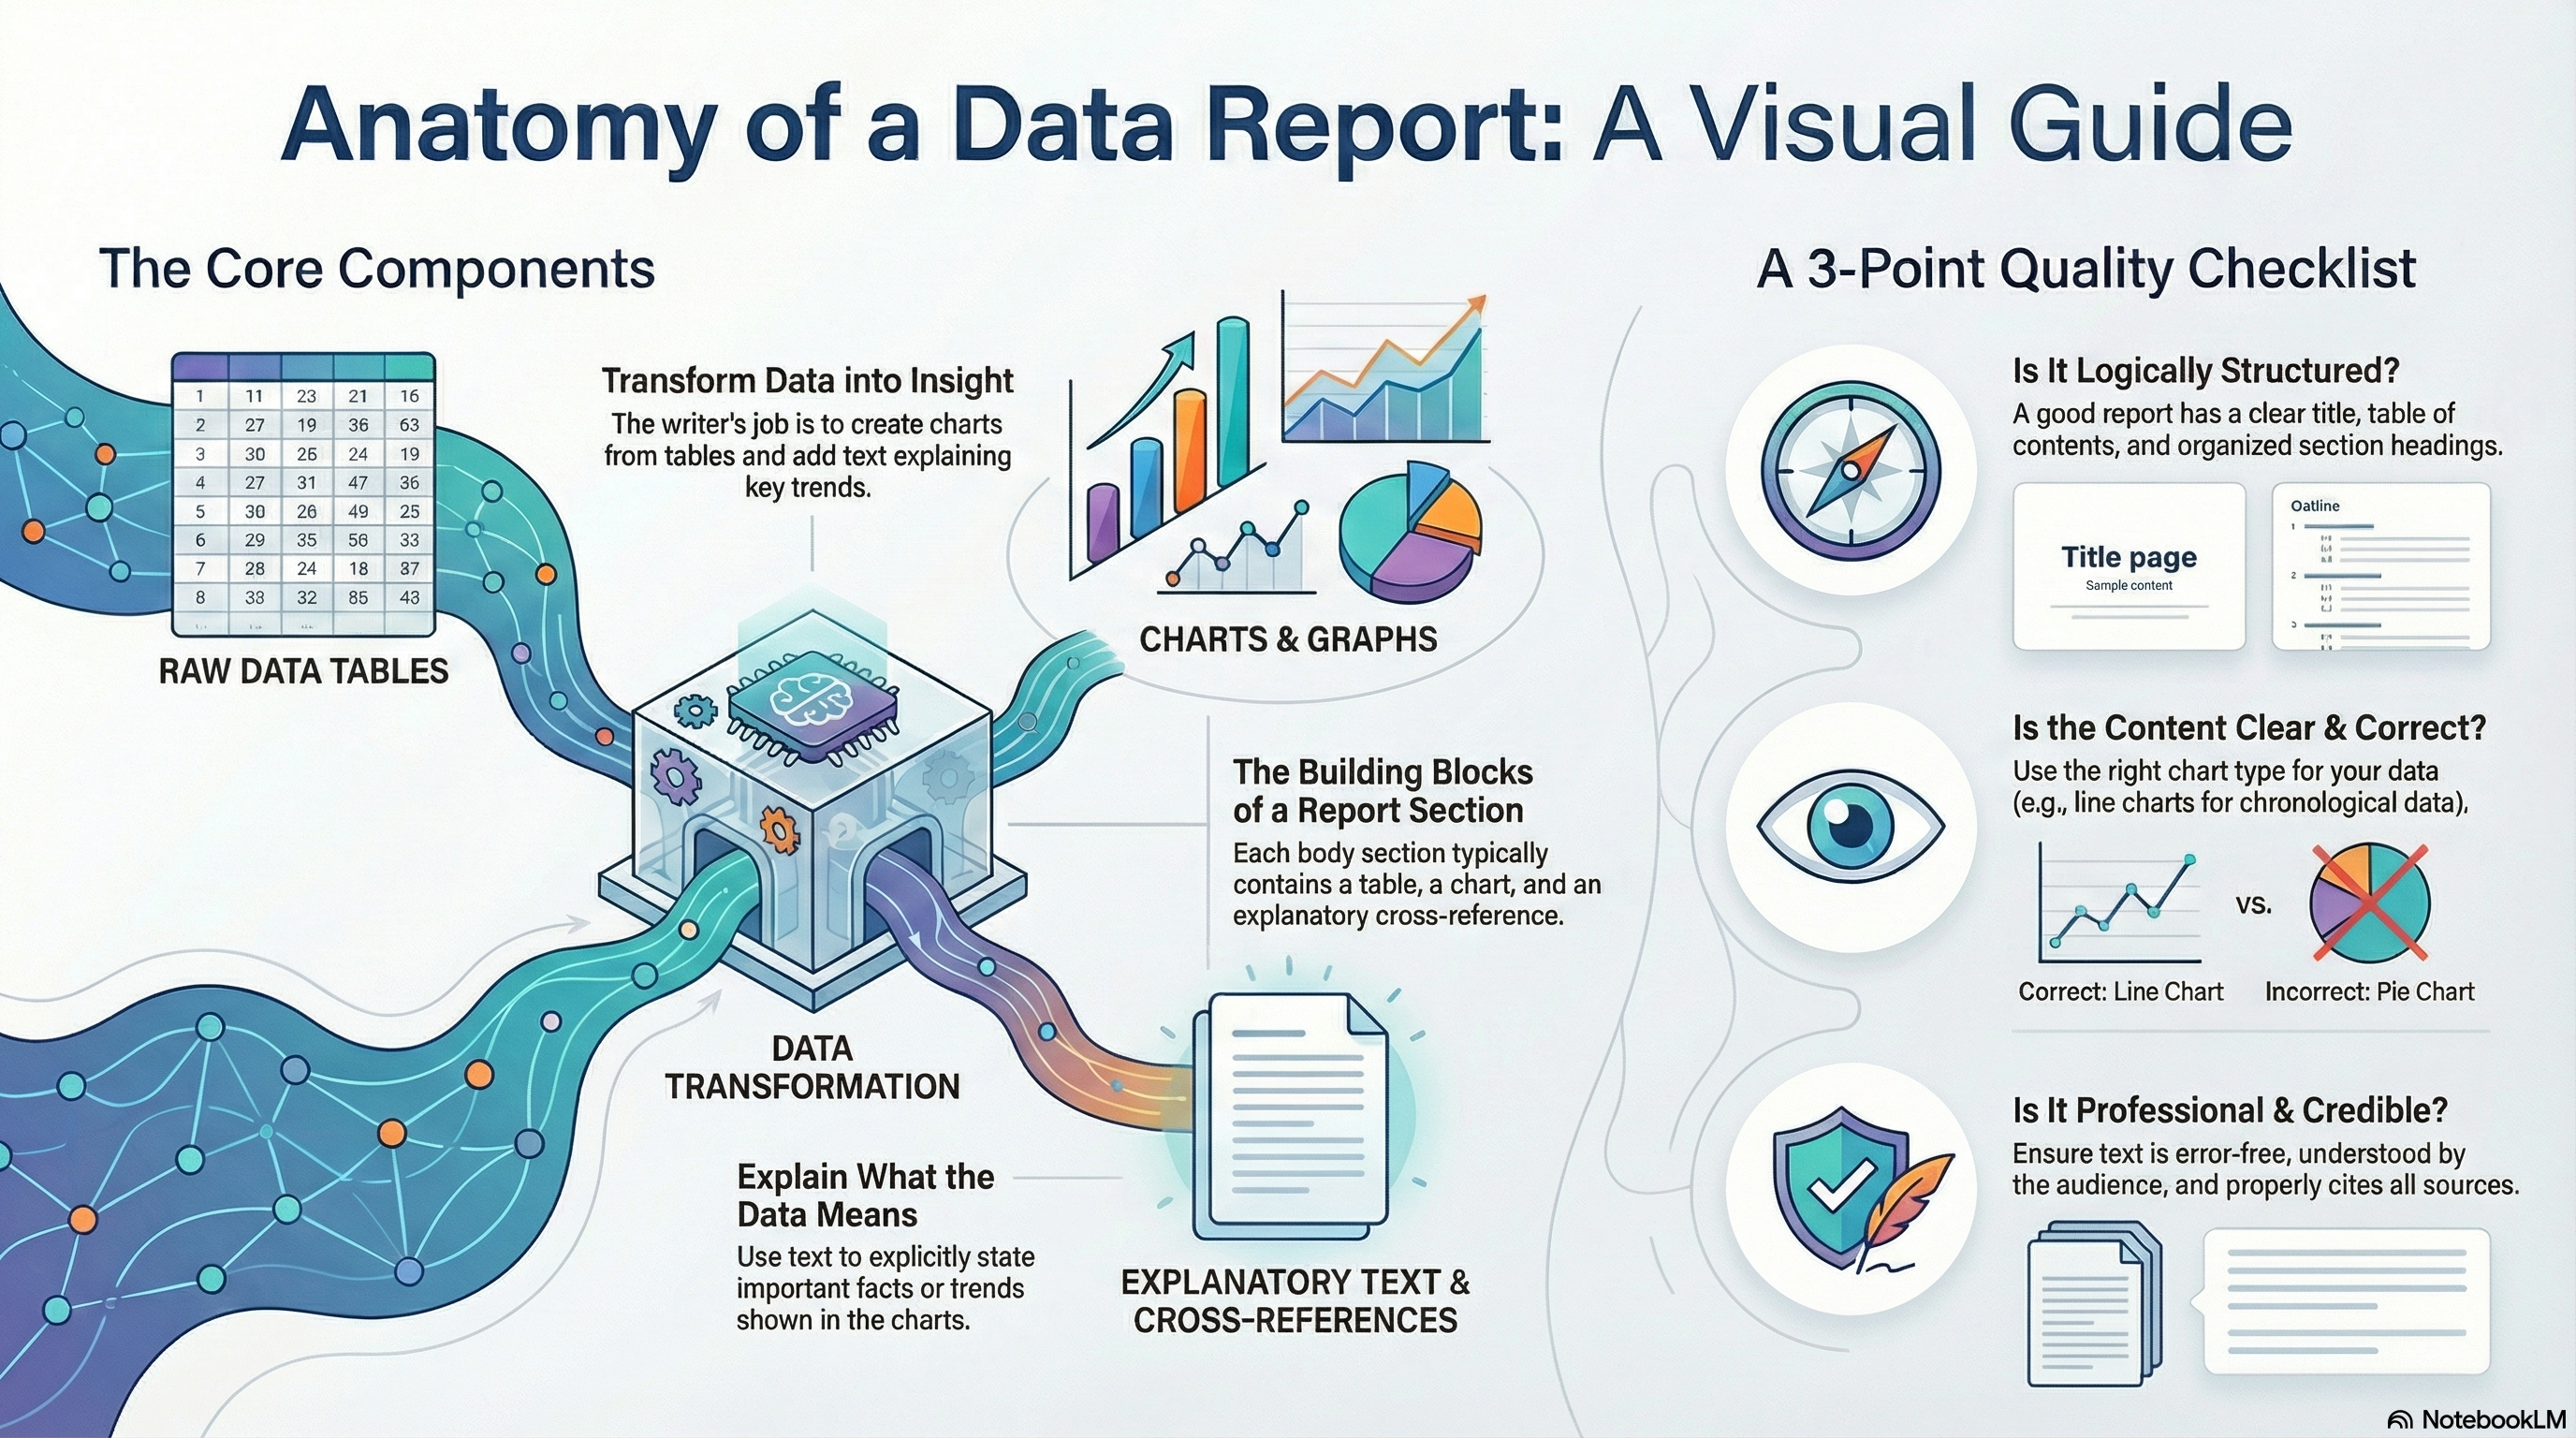 NotebookLM-generated infographic of this chapter
Anatomy of a Data Report
Like humans, data reports come in all shapes and sizes. Presented here is one framework that you can use as-is or modify.
If you are creating a data report, see Create Data Report
- Notice the basic contents of the body sections of the example data reports, not necessarily in this order or all included:
heading
table
chart
explanatory cross-reference
source indicator
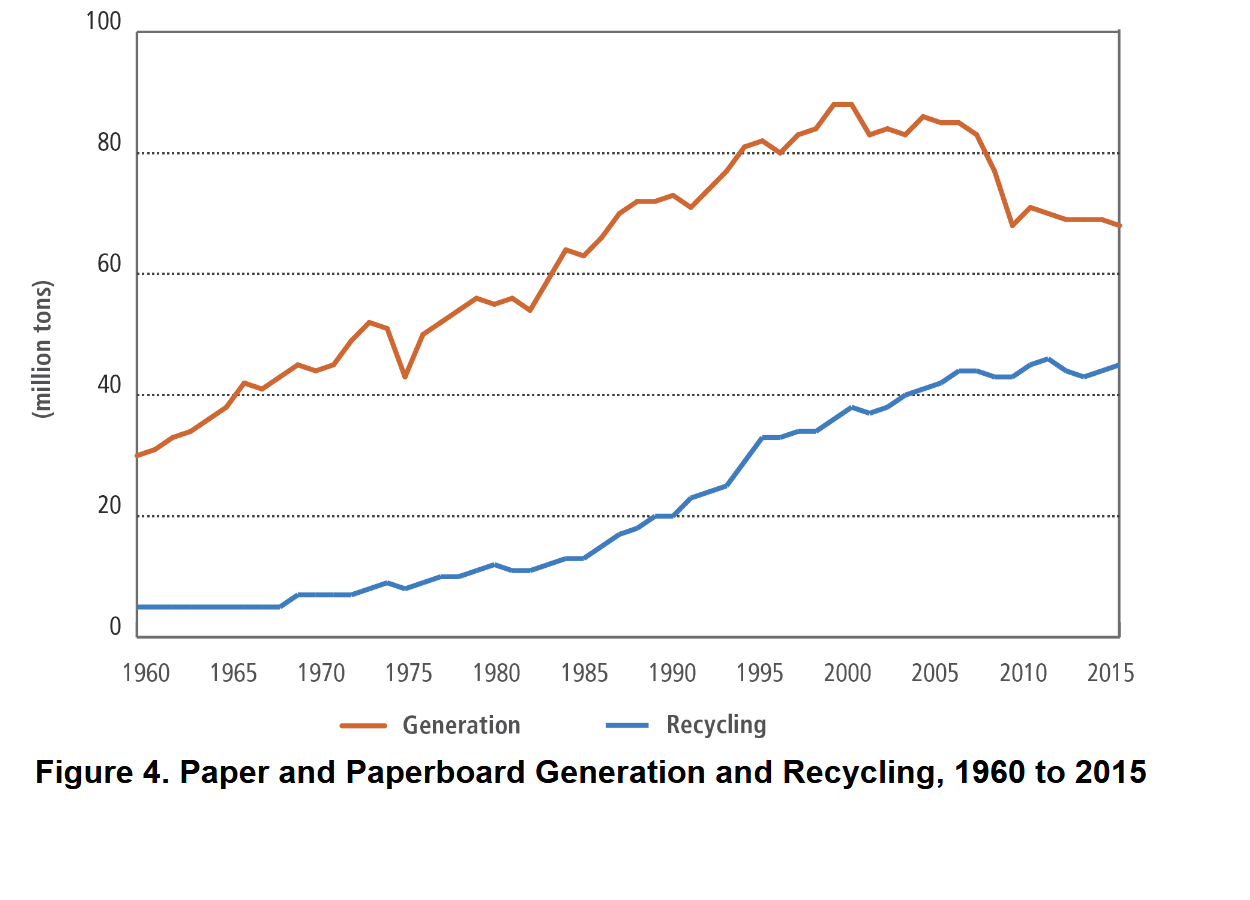
Notice in this example the structure of an individual section in a data report: table (omitted), graph, explanatory cross-reference:
As can be seen in Figure 4, generated paper materials have outdistanced recycled paper materials 6730 million tons 4760 million tons over the the 1960 to 2015 period.
Here's another example of an explanatory cross-reference:
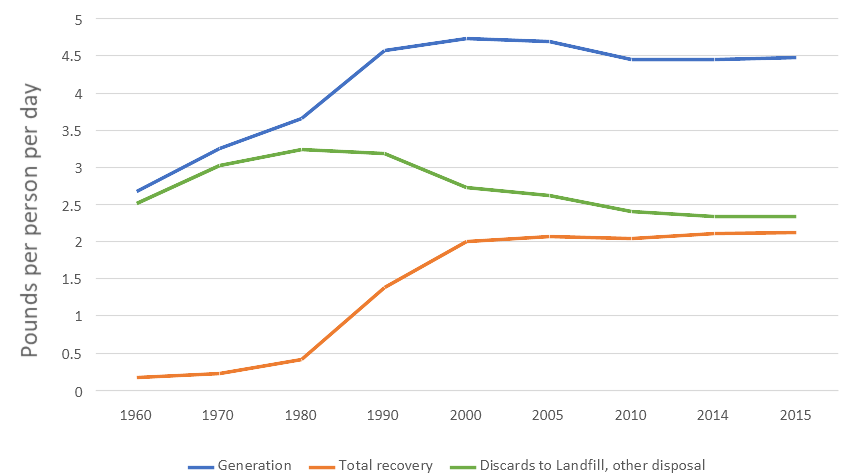
Figure 6. MSW Pounds per Person per Day
As you can see in the figure above, progress in recovery of municipal solid waste (MSW) was increasing until year 2000 but has stalled since then.
AI Prompts for Data Reports
Checklists, which typically go unread, can be used as source for AI prompts with some modification. Copy the following, paste it into an AI system such as Google's Gemini, and see what you may have missed.
Note: All references to the content, format, style of data reports or its components can be found at online technical-writing textbook.
|
AI Prompts for Data Reports
- Does the data report contain at least the following (properly formatted) in this order: table of contents; list of figures, tables, or combined; introduction; body sections (chapters); information sources. For details, see Techdoc design.
- While it can be clever and playful, does the title of the data report adequately indicate its subject matter? For details, see Techdoc titles.
- If the table of contents and list of figures (and table) use leader dots, are the page numbers right-aligned. If the table of contents and list of figures (and table) include page numbers on the right edge of the page, are leader dots used? For details, see TOCs and List of Figures (Tables).
- Does the introduction adequately indicate the topic, purpose, and intended audience of the techdoc? Does it provide a list of subtopics to be covered and an indication of
scope (what's not covered)? For details, see Introductions.
- Do the citations (references to items in the information-sources list) occur in the body of the techdocformatted according to APA, MLA, or modified IEEE style? Are the items in the information sources list formatted according to APA, MLA, or modified IEEE style? For details, see Documentation: borrowed information sources.
- Does each body section of this data report start with an identifying heading? For details, see Headings.
- Does each body section of this data report contain a table, a chart illustrating that table, and an explanatory cross-reference paragraph (in any order)? For details, see Tables; Tables and Charts in Microsoft; Tables and Charts in Google Sheets.
- Are the charts in this data report logical? For example, is the line chart used only for data that is chronological?
- Does the data report contain at least one bar or column chart, pie chart and line chart?
- Do the explanatory cross-reference paragraphs cite at least one important fact or trend in the table and chart?
- Do all tables and charts include a descriptive title (caption) and source (if needed)? For details, see Table titles.
- Do all tables and non-decorative figures occur as near as possible to their relevant text?
- Is the text of the data report free of grammar, usage, and punctuation errors? For details, see Common Grammar, Usage, Spelling Problems.
- Is the text of the data report free of wordiness and other sentence style errors? For details, see Wordiness, other sentence-style problems.
- Can this techdoc be understood by its target audience (as indicated in the transmittal message and introduction)? For details, see Audience analysis, and see Translating the Technical.
- Does this data report contain text that is directly quoted, paraphrased, or summarized from other sources but that is not documented, indicating plagiarism? For details, see Plagiarism. Purdue OWL.
- Considering the above evaluations:
- What's good about this data report?
- What's not so good about this data report?
- What is the numeric grade (100 base) that could be assigned to this data report using the evaluative questions above?
|
Note: All references to the content, format, style of data reports or thei components can be found in the online technical-writing textbook.
Related Information
Reading quiz. Use this quiz to test your understanding of this chapter.
Training available. Get some practice writing with McMurrey as your instructor.
I would appreciate your thoughts, reactions, criticism regarding this chapter: your response—David McMurrey.